.webp)
How to calculate new hire turnover rate
Use the right new hire turnover formula, avoid denominator mistakes and turn the number into better hiring decisions.

Use the right new hire turnover rate formula
If you want to know how to calculate new hire turnover rate, start with the cohort formula, not the generic employee-turnover formula:
New hire turnover rate = new hires who left within the chosen period / new hires eligible to complete that period x 100
For example, if 50 people started between January and March, and eight left before completing 90 days, the 90-day new hire turnover rate for that cohort is 16%. If the same cohort has 11 people leave before their first anniversary, the 12-month rate is 22%.
The denominator matters more than the arithmetic. New hire turnover should measure people who had a fair chance to reach the window you are analysing. Someone who started three weeks ago cannot yet count in a 90-day turnover calculation. They are not retained, not lost and not evidence of anything except the passage of time being annoyingly linear.
This is different from the standard employee turnover formula, which usually divides separations in a period by average headcount. That formula is useful for overall workforce churn. New hire turnover is narrower: it asks what share of recent starters leave inside a defined early-tenure window. HRBench describes the one-year version as people who leave before their first work anniversary, which is the cleanest version for hiring-quality analysis.
Pick the time window before you touch Excel
Before you open a spreadsheet, decide which early-tenure window you actually care about. A 30-day new hire turnover rate usually points to job shock, offer regret, pay confusion, scheduling problems or onboarding failure. A 90-day rate often reveals whether the interview and assessment process matched the work. A six-month or 12-month rate is better for roles with longer ramp time, where performance and fit take longer to become visible.
The Bureau of Labor Statistics treats hires and separations as monthly flow measures, which is a useful way to think about this. You are counting events across a period, not taking a photograph of headcount on one date. That is why the calendar year can mislead you. A person hired in December has not had the same exposure as someone hired in January.
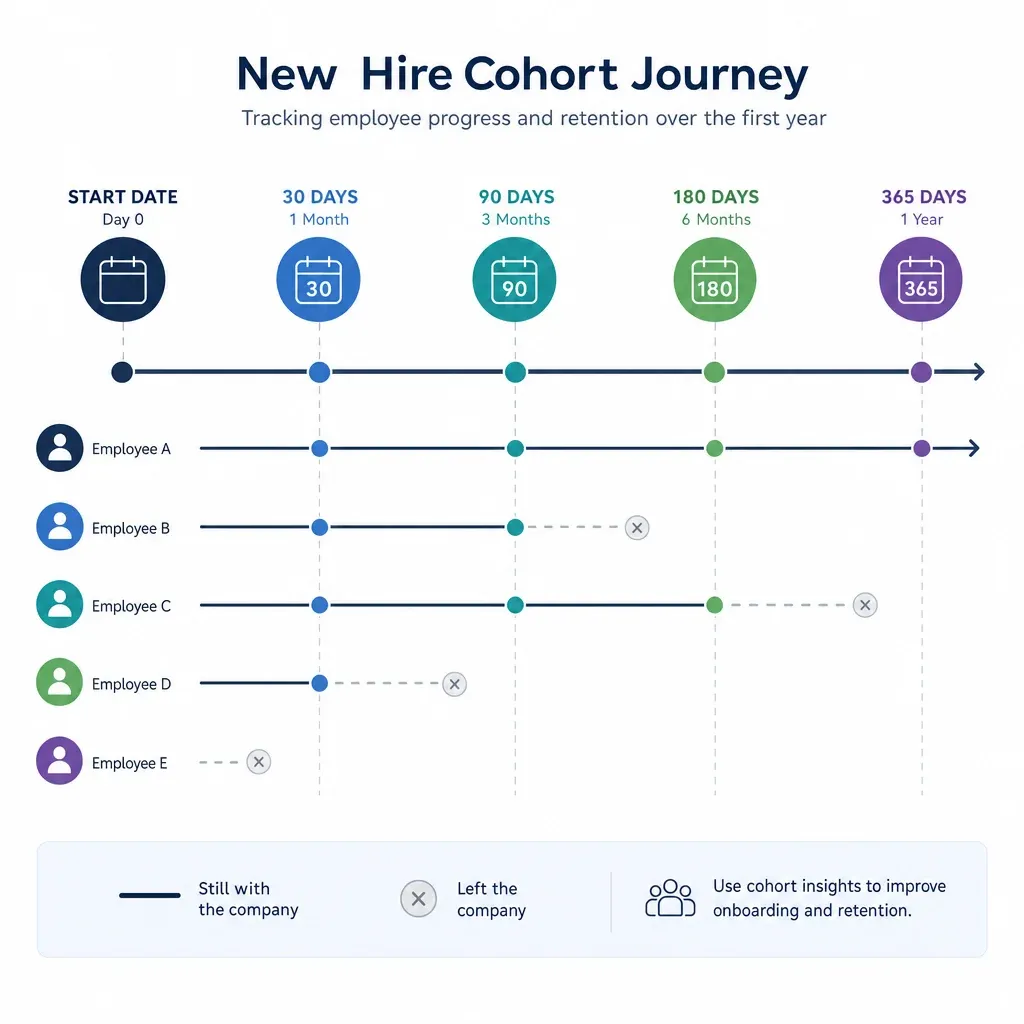
For most small businesses, the best default is a rolling cohort view. Take everyone who started in a completed month or quarter, then ask how many left before 30, 90, 180 or 365 days. Rolling 12-month cohorts are especially useful because they avoid the false neatness of the financial year.
So, for "How do you calculate rolling 12 month turnover?", use employees whose start dates are old enough to have reached 12 months, count the ones who left before day 365, divide by the total eligible cohort and multiply by 100. Everyone else waits in the observation queue. Spreadsheets do not like patience, but this is where you must teach them some.
How to calculate new hire turnover rate in Excel
To calculate employee turnover in Excel for new hires, you need a simple employee-level table. At minimum, include employee ID, start date, termination date, termination type, role, hiring manager, location and source. Add performance rating or ramp milestone later if you have it. Do not begin with a dashboard. Begin with rows that tell the truth.
For a 90-day cohort, add a helper column called LeftWithin90. If start date is in B2 and termination date is in C2, the logic is:
=IF(AND(C2<>"",C2-B2<=90),1,0)
Then calculate the rate for hires who started between two dates:
=COUNTIFS(B:B,">="&StartDate,B:B,"<="&EndDate,Helper:Helper,1)/COUNTIFS(B:B,">="&StartDate,B:B,"<="&EndDate)

Format the result as a percentage. If you are analysing 12-month turnover, include only people whose start date is at least 12 months before the reporting date. Otherwise your denominator will include people who could not possibly have completed the period. That makes the rate look better by accident, which is the most irritating kind of success.
The broader formula - employees who left divided by average employees - still belongs in your workforce dashboard. It answers a different question: how much total churn did the organisation experience? The new-hire version answers a sharper question: are recent hiring decisions producing people who stay long enough to prove the decision right?
Turn the number into a new hire retention rate
Your new hire retention rate is the same cohort viewed from the other side:
New hire retention rate = new hires still employed at the end of the chosen period / new hires eligible to complete that period x 100
If 50 people started in a completed cohort and 39 were still employed after 12 months, the 12-month new hire retention rate is 78%. The matching new hire turnover rate is 22%. They should add up to 100% if you are using the same population, the same period and the same rules.
What is a good retention rate for new hires? It depends on the role, industry, labour market and operating model. A 95% rate in a seasonal role may mean you are counting the wrong population. A 75% rate in a difficult sales role may be acceptable if performance among retained hires is strong and exits are expected. Context is not an excuse, but it is required arithmetic.
Be careful with retention on its own. Keeping people is not the same as hiring well. A team can retain underperformers because managers avoid difficult conversations, because standards are vague or because the job market is soft. That is why new hire retention should sit beside ramp speed, manager confidence, performance and regretted versus non-regretted exits.
Compare by industry, role and hiring source
Searches for new hire turnover rate by industry are understandable. Benchmarks are comforting because they let you decide whether your number is terrible, normal or just wearing a terrible hat. Salary.com's discussion of new hire turnover rate by industry is useful for perspective, but an external average should never become your explanation.
Segment the rate before you judge it. Cut it by role family, hiring manager, location, source, recruiter, pay band, voluntary versus involuntary exit and start month. A 20% new hire turnover rate means one in five eligible new hires left inside the window. That could be a manageable operational cost, or it could hide one team losing half its starters while everyone else looks fine. Averages are where problems go to nap.
Work Institute's first-year turnover reasons show why interpretation needs care: early exits can involve management, work-life balance, health and family issues, job factors and involuntary decisions. Hiring is not always the cause, but it is often where expectations, evidence and reality first diverge.
This is where quality of hire enters. McDaniel et al. (1994) found that structured interviews are more valid than unstructured ones, but tenure is a noisier criterion than performance. Cornwell, Schmutte and Scur (2019) add a management lens: firms with more structured practices hire and retain stronger workers. The practical point is sober: use the metric to find where selection quality, job design and management practice need investigation.
What to do when the rate is too high
A high new hire turnover rate is not a moral failing. It is a diagnostic prompt. The worst response is to tell interviewers to "trust their gut more carefully", which is roughly as useful as asking a printer to jam with more intention.
Start with the job itself. Were the hard parts of the role named honestly before offer? Did the scorecard test the capabilities that actually decide success? Did every candidate answer comparable questions? Were answers scored against anchored standards, or did the room reward confidence, polish and similarity? Campion, Palmer and Campion (1997) identified practical components of structure - job analysis, same questions, anchored rating scales, notes and multiple interviewers among them. Levashina et al. (2013) later summarised the broader evidence that structured interviews are more reliable and valid than unstructured ones.
The reason this matters is not academic tidiness. Dana, Dawes and Peterson (2012) showed how unstructured interviews let people make sense of almost anything a candidate says. Kausel, Culbertson and Madrid (2016) found that unstructured interview information can increase overconfidence and hurt selection decisions. If early turnover is concentrated in a role, the answer is rarely "do another vibes-based chat". It is to improve the evidence.

That is the problem the Structured Hiring Method is built around. HireSchool is a self-guided digital programme that helps small businesses and scale-ups install a structured hiring process: interview flow, capabilities tested, candidate assessment and decision mechanics, all taught through video and an LMS rather than a consultant sitting in your meeting room with a laminated framework.
The connection to quality of hire is direct. If your new hires leave quickly because the role was mis-sold, the interview tested the wrong things or decision meetings overvalued charm, the metric has done its job by pointing at a process fault. Fix the role scorecard, standardise the evidence, calibrate ratings and review early exits against the promises made before offer. You are not trying to make every new hire stay forever. You are trying to make the next decision less theatrical and more true.
Build a quarterly review habit
The formula only matters if it changes what happens next. Review your new hire turnover rate every quarter with the same basic dashboard: eligible cohort size, 30-day exits, 90-day exits, 12-month turnover, matching retention rate, voluntary versus involuntary exits, role, hiring manager, source, performance and ramp progress. If the denominator is tiny, show the raw count beside the percentage. Three leavers out of eight is not the same management conversation as 30 out of 80.
What does a 20% turnover rate mean? In plain English, one in five eligible new hires left inside your chosen period. Whether that is acceptable depends on the role and the pattern. If the leavers cluster under one manager, come from one source or all cite job mismatch, you have a practical lead. If they are scattered across unrelated life events, the metric is less damning.
The recruiting version of the 80/20 rule is useful only as a diagnostic habit: look for the small number of causes, roles or sources producing most of the damage. Do not turn it into folklore. Hiring already has enough folklore. A simple quarterly review, tied to changes in the next role brief and interview process, will do more than an elaborate dashboard nobody trusts.