.webp)
Quality of hire: a working definition and how to measure it
What quality of hire actually is, the four components scorecards combine, and the structured assessment that has to sit upstream.

Why quality of hire is the metric everyone wants and few have
LinkedIn's 2025 Future of Recruiting report turned up a slightly awkward number. Eighty-nine per cent of talent acquisition professionals agreed that measuring quality of hire was going to matter more, not less, over the next few years. Twenty-five per cent were confident their organisation could actually do it. That is the gap between belief and capability, and it has been wide for a while.
The reason is mundane. Time-to-fill and cost-per-hire are easy to measure because the data sits in the applicant tracking system and the finance ledger. Quality of hire requires you to follow the person past the offer, into the role, through the first review cycle, and then decide what their performance, retention and ramp say about the choice the company made six months earlier. So companies report what they can count, and the metric they actually care about gets a paragraph in the annual review. Harver's own data suggests only a third of companies feel they have strong measurement tactics; five per cent describe themselves as best in class.
Laszlo Bock, formerly head of people at Google, framed the problem bluntly: hiring is the most important people function you have, and most of us aren't as good at it as we think (TRG Talent, 2016). The trouble is that without a working definition of quality of hire, there is no way to find out whether you are.
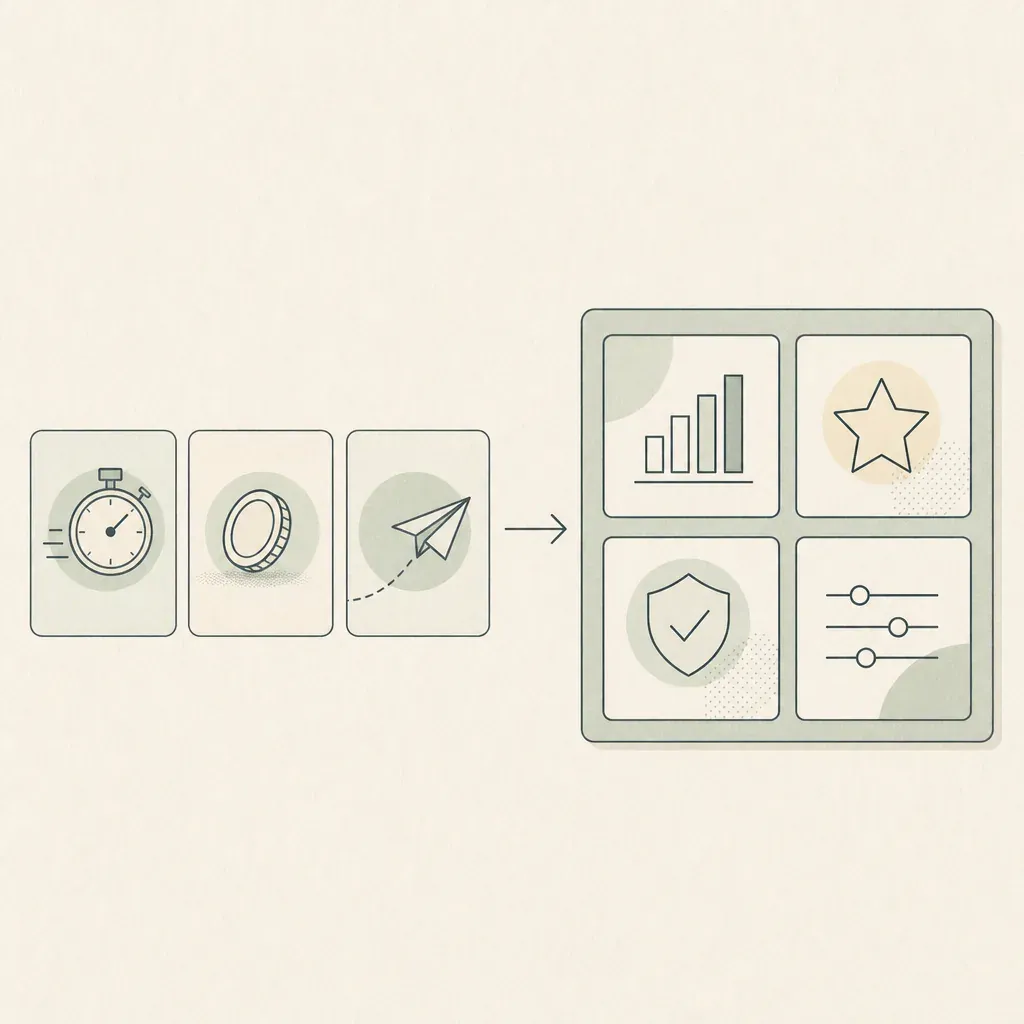
This article does three things. It gives a clean working definition. It walks through how to measure it. And it explains why none of it works without a structured assessment upstream feeding the score.
A clean working definition
Quality of hire is the value a new employee delivers, measured against the expectations the company set when it hired them. That is the short version. The long version, codified in the ISO/TS 30411:2018 standard, defines it as the performance of an individual after hire compared to pre-hire expectations. SHRM frames the same idea slightly differently: an aggregated index of relevant metrics designed to evaluate whether the hiring process actually worked.
The first thing to be clear on is what this metric is not. It is not a process metric. Time-to-fill, cost-per-hire, offer-acceptance rate and source-of-hire all measure the funnel: how quickly, how cheaply, how reliably the recruitment machinery does its job. They are useful and they are easy. They also tell you nothing about whether the person you hired was the right one. Quality of hire sits one level downstream and asks the harder question.
The second thing to be clear on is that quality of hire is not a single performance review. It is a composite recruitment metric, evaluated at fixed intervals across the new hire's first year and combining multiple signals at each one. The standard checkpoints are 30, 90, 180 and 365 days. The composite character is what makes it a scorecard rather than a rating: any single input is noisy, but several pulled together give a more useful picture of whether the decision held up.
Quality of hire in recruitment is, in plain terms, the answer to the question "did our hiring choice produce the outcome we wanted?". The rest of the work is deciding which inputs you trust to answer it.
The four components most scorecards combine
A quality of hire scorecard usually combines four standard components. Different vendors weight them differently, but the same four turn up almost everywhere.
Performance rating. Does the new hire's manager rate them at or above the expected level once they have settled in? This is normally measured against the same scale the company already uses for performance reviews, scored at 90 days and again at 12 months. If the new hire is at "meets expectations" by 90 days and trending toward "exceeds" by the year mark, the rating component is healthy.
Retention. Are they still there at 12 months. The bluntest of the four components and arguably the most informative. A new hire who left in month seven is a quality-of-hire failure even if their performance rating was glowing. Retention captures both the fit question (did the company keep this person) and the prediction question (did the hiring panel see what was actually there).
Hiring manager satisfaction. One question, asked of the manager: knowing what you know now, would you hire this person again? Ashby's view is that hiring manager satisfaction is often the strongest indicator of a new hire's downstream performance, partly because the manager has more context than any single review captures.
Time-to-productivity. How long until the new hire is delivering at the level the role assumes. This one is easier to measure for some roles than others; a sales hire's quota ramp is legible in a way that a product manager's is not. Where it can be measured cleanly, it tells the company whether onboarding and role definition are doing their part.
The simplest scorecard averages the four components equally. The more common weighted version gives 40 per cent to performance, 20 per cent each to retention and time-to-productivity, and 10 per cent each to manager satisfaction and culture fit. Either way the result is scored on a 100-point scale so cohorts can be compared across time. The exact maths, the formula variants, and which weights fit which company sits in the metrics-and-formulas piece. This article's job is to make the components legible.
Why subjective inputs are the metric's weakest link
Look back at the four components and notice something uncomfortable. Three of them - performance rating, hiring manager satisfaction, and in many companies time-to-productivity - depend on the same manager's judgement. A composite metric assembled from heavily correlated subjective inputs is not four independent signals. It is one rater's view, scored four times.
This matters because the rater has been forming an impression of the candidate since the interview. Dana, Dawes and Peterson (2012) ran three studies on what they called the persistence of the unstructured interview illusion. Two findings stand out. The first is sensemaking: interviewers reliably rationalise virtually any answer the candidate gives, including answers generated from a random number table. The second is dilution: non-diagnostic information from an unstructured interview actively weakens the predictive value of better signals the interviewer already had. Their summary recommendation for selection committees was, with no hedging, not to use unstructured interviews.
The same dynamic operates after the hire. A hiring manager who formed a strong gut impression in interview tends to find evidence for it in the first month and then rate the new hire accordingly. Bohnet (2016), writing in the Harvard Business Review, made the related point that unstructured assessment lets gender bias enter manager ratings before the candidate has done a day's work. The bias does not come from the calculation; it comes from the data feeding it.
The implication for quality of hire is bracing. A scorecard built on unstructured upstream assessment is a confidence trick. It produces a number, that number can be tracked over time, and it will not tell you what you think it is telling you. It will tell you about your raters. The score is only as honest as the assessment that fed it.
Structured assessment is the upstream condition
The good news is that the assessment problem has been studied for forty years and the answer has not changed. Every meta-analytic review of the employment interview literature for three decades has found that structured interviews substantially out-predict unstructured ones. McDaniel, Whetzel, Schmidt and Maurer (1994) made the case across 245 validity coefficients drawn from 86,311 individuals. Wiesner and Cronshaw (1988) had reached the same conclusion six years earlier with a smaller sample. Levashina, Hartwell, Morgeson and Campion (2013) updated the picture and confirmed it.
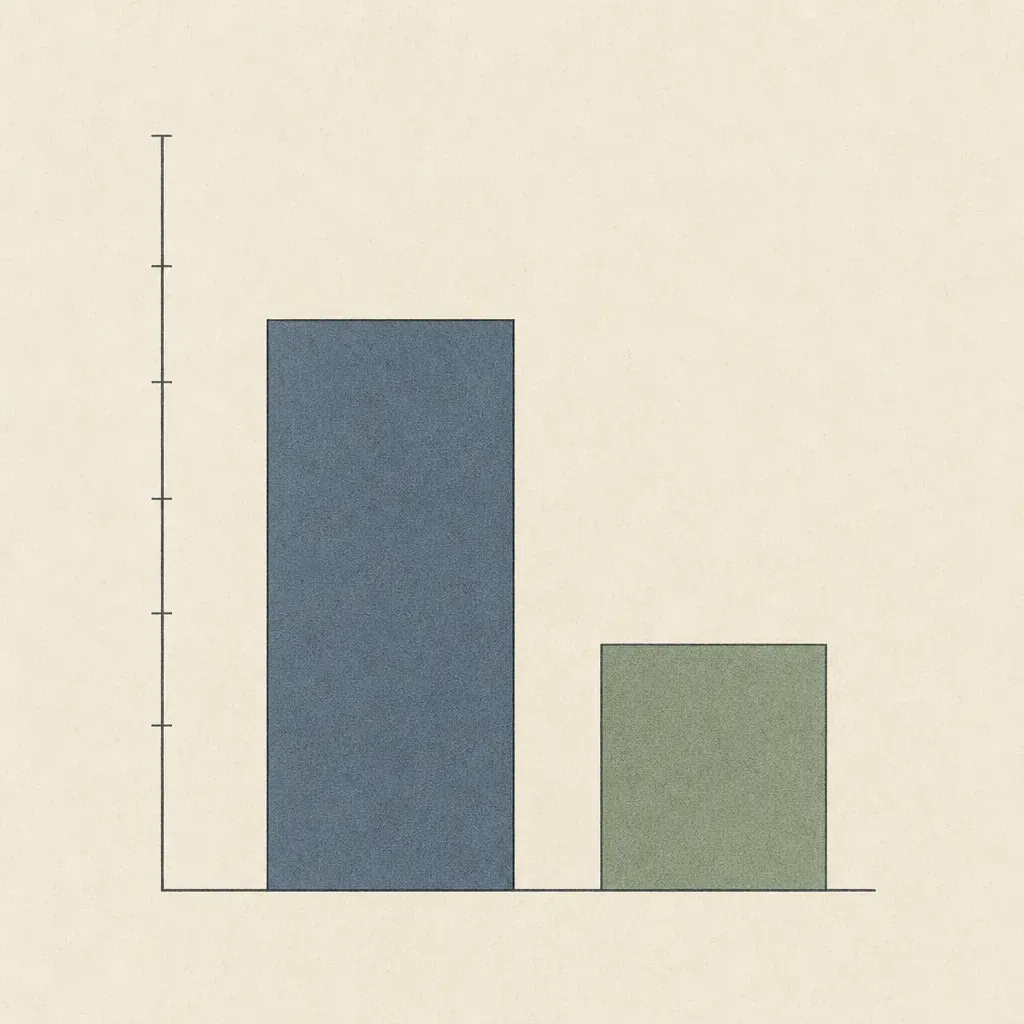
The headline numbers are worth quoting. Structured interviews land validity coefficients in the 0.51 to 0.63 range, against around 0.38 for unstructured formats. In organisational psychology a coefficient of 0.50 or above is considered strong; 0.38 is, charitably, weak. The predictive validity gap between structured and unstructured interviewing is not a margin. It is the difference between a useful prediction and a coin toss with a story attached.
Campion, Palmer and Campion (1997) catalogued 15 components of interview structure and found the effect is roughly additive. The components in the strong-evidence cluster are familiar enough: ask every candidate the same questions, anchor the rating scale to observable behaviours rather than gut impressions, run a panel rather than a single interviewer, take notes, score independently before discussing, and keep candidate questions to the end so they do not contaminate the assessment. None of these is exotic. Most are free.
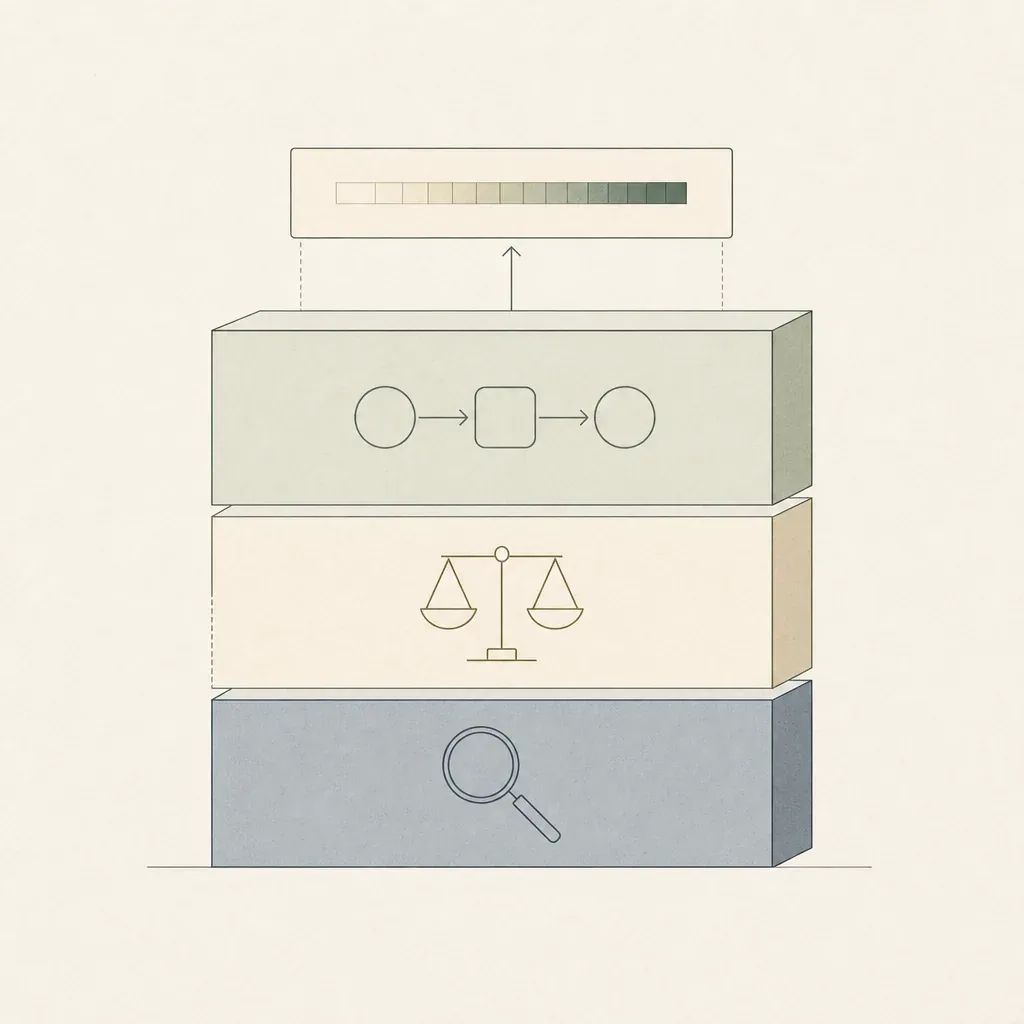
The link back to quality of hire is now visible. A structured interview produces calibrated assessments. Calibrated assessments set realistic manager expectations. Realistic expectations make the three judgement-driven components of the quality of hire scorecard - performance rating, manager satisfaction, time-to-productivity - measure something other than rater variance. Without structured assessment upstream, the scorecard is laundering the same biases the interview process introduced. With it, the scorecard becomes a thermometer for a process that actually works. The structured interview is not a nice-to-have alongside the metric. It is the precondition for the metric being meaningful.
Where to start: install the assessment, then the scorecard
By this point the picture is clear. The four-component scorecard is the dashboard. Structured assessment is the engine. Building the dashboard before fixing the engine produces tidy numbers that mean very little. The practical question is what to install first, and the honest answer is the assessment.
HireSchool sells one such installation. The product is called the Structured Hiring Method, and it is a self-guided digital programme delivered as video content plus a learning management system. Companies buy access and roll it out themselves. The LMS handles onboarding the team, tracking progress, and holding every interviewer to the same playbook. It is not consultancy: there are no HireSchool staff embedded in your hiring process. It is not an applicant tracking system: your ATS keeps doing the ATS job. It is the method that sits between the two.
What the programme installs is the upstream stack the previous section described, in concrete form. Predefined Leadership Values the company chooses from to hire against, so capabilities are agreed before candidates are scored rather than negotiated afterwards. A codified performance assessment methodology, so two interviewers rating the same evidence land in roughly the same place. A standardised role hiring process flow, so every candidate and every hiring manager knows what the steps are. Behavioural interviewing training, built on the principle that past behaviour in similar situations is the best predictor of future behaviour. And a decision management module that produces evidence-based decisions a company can defend a year later when someone asks why this candidate and not that one.
The reader this is built for is running a small business or scale-up that has felt the pinch as headcount climbed past thirty, fifty, eighty. Hiring that worked when the founder did all the interviews starts to drift when six different hiring managers each run their own version of the same loop. Some panels test capability, some test vibes. Some scorecards exist on paper, some live in the head of whichever interviewer remembered to bring one. The point of installing the method is that every interviewer hires to the same standard, which is the precondition for a quality of hire scorecard that tracks anything other than rater variance.
HireSchool is not a recruiting agency, a job board, or a hiring marketplace. It does not source candidates. It does not run your panels. What it does is codify the assessment, decision and process pieces so the company's own hiring managers run a consistent, evidence-based interview loop. Once that is in place, a scorecard has something honest to measure.
The clear next step, if any of the above lands, is to explore the Structured Hiring Method programme and see how the assessment, decision and process pieces fit together before you wire up the scorecard on top.
A 30/60/90 question that beats no measurement at all
Most companies will not stand up a four-component weighted quality of hire scorecard tomorrow. They might in six months. In the meantime there is one move worth making, and it costs nothing.
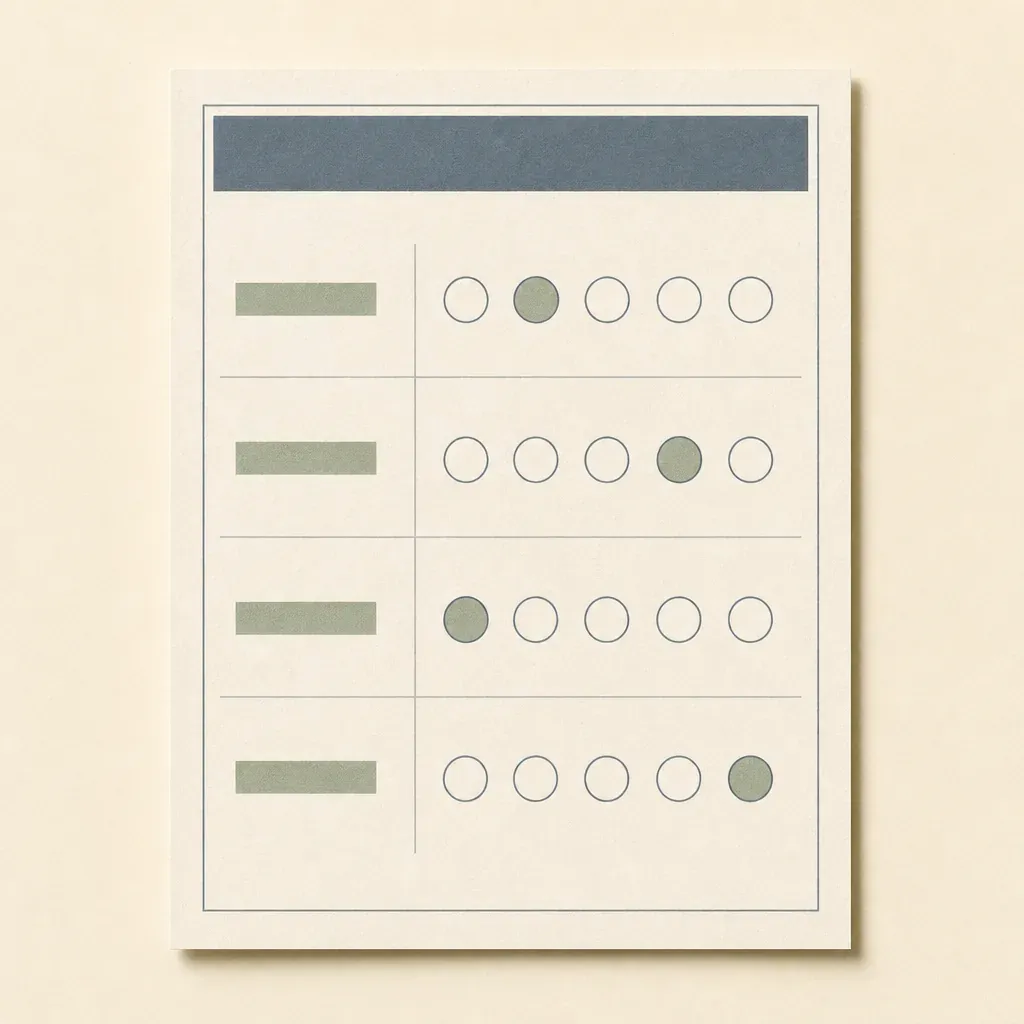
At 30, 60 and 90 days, ask the hiring manager one question. Knowing what you know now, would you hire this person again? Score it on a one to five scale. Record the answer next to the role, the panel, the source channel, and the interviewers who recommended the hire. Ashby recommends roughly the same starting move with automated check-ins at 30, 60 and 90 days, on the basis that hiring manager satisfaction is the single strongest indicator most teams have within reach.
The trends in that one number across cohorts will tell the team more than they currently have. A panel that consistently produces ones and twos at 90 days is a panel to retrain. A sourcing channel that consistently produces fives is a sourcing channel to lean on. As the structured assessment matures, layer the other three components - performance rating, retention, time-to-productivity - on top, and let the weighted scorecard emerge as the data deserves it.
The metric is a thermometer. The treatment lives upstream in how the candidate was assessed, scored and decided on in the first place. Build the thermometer if you want one. Just do not assume the reading is the cure.